AutoGraph: Predicting Lane Graphs from Traffic

1University of Freiburg, Germany, 2University of Oxford, 3University of Technology Nuremberg

AutoGraph aggregates tracked vehicle tracklets and predicts complex lane graphs without requiring any lane graph annotations.

Abstract

Lane graph estimation is a long-standing problem in the context of autonomous driving in urban environments. Previous works aimed at solving this problem by relying on large-scale human-annotated graph annotations, introducing the bottleneck of limited available annotations for training models to solve this task. To overcome this limitation, we propose a novel data source for lane graph annotations: the movement of traffic participants.

In our AutoGraph approach, we employ a pre-trained object tracker and collect the tracklets of traffic participants such as vehicles and trucks. We show that it is possible to train a successor lane graph prediction model from this data without requiring any human supervision. In the second stage, we show how the single successor predictions can be aggregated into an accurate and consistent lane graph. We demonstrate the efficacy of our approach on the UrbanLaneGraph dataset and perform extensive quantitative and qualitative evaluations.

Approach

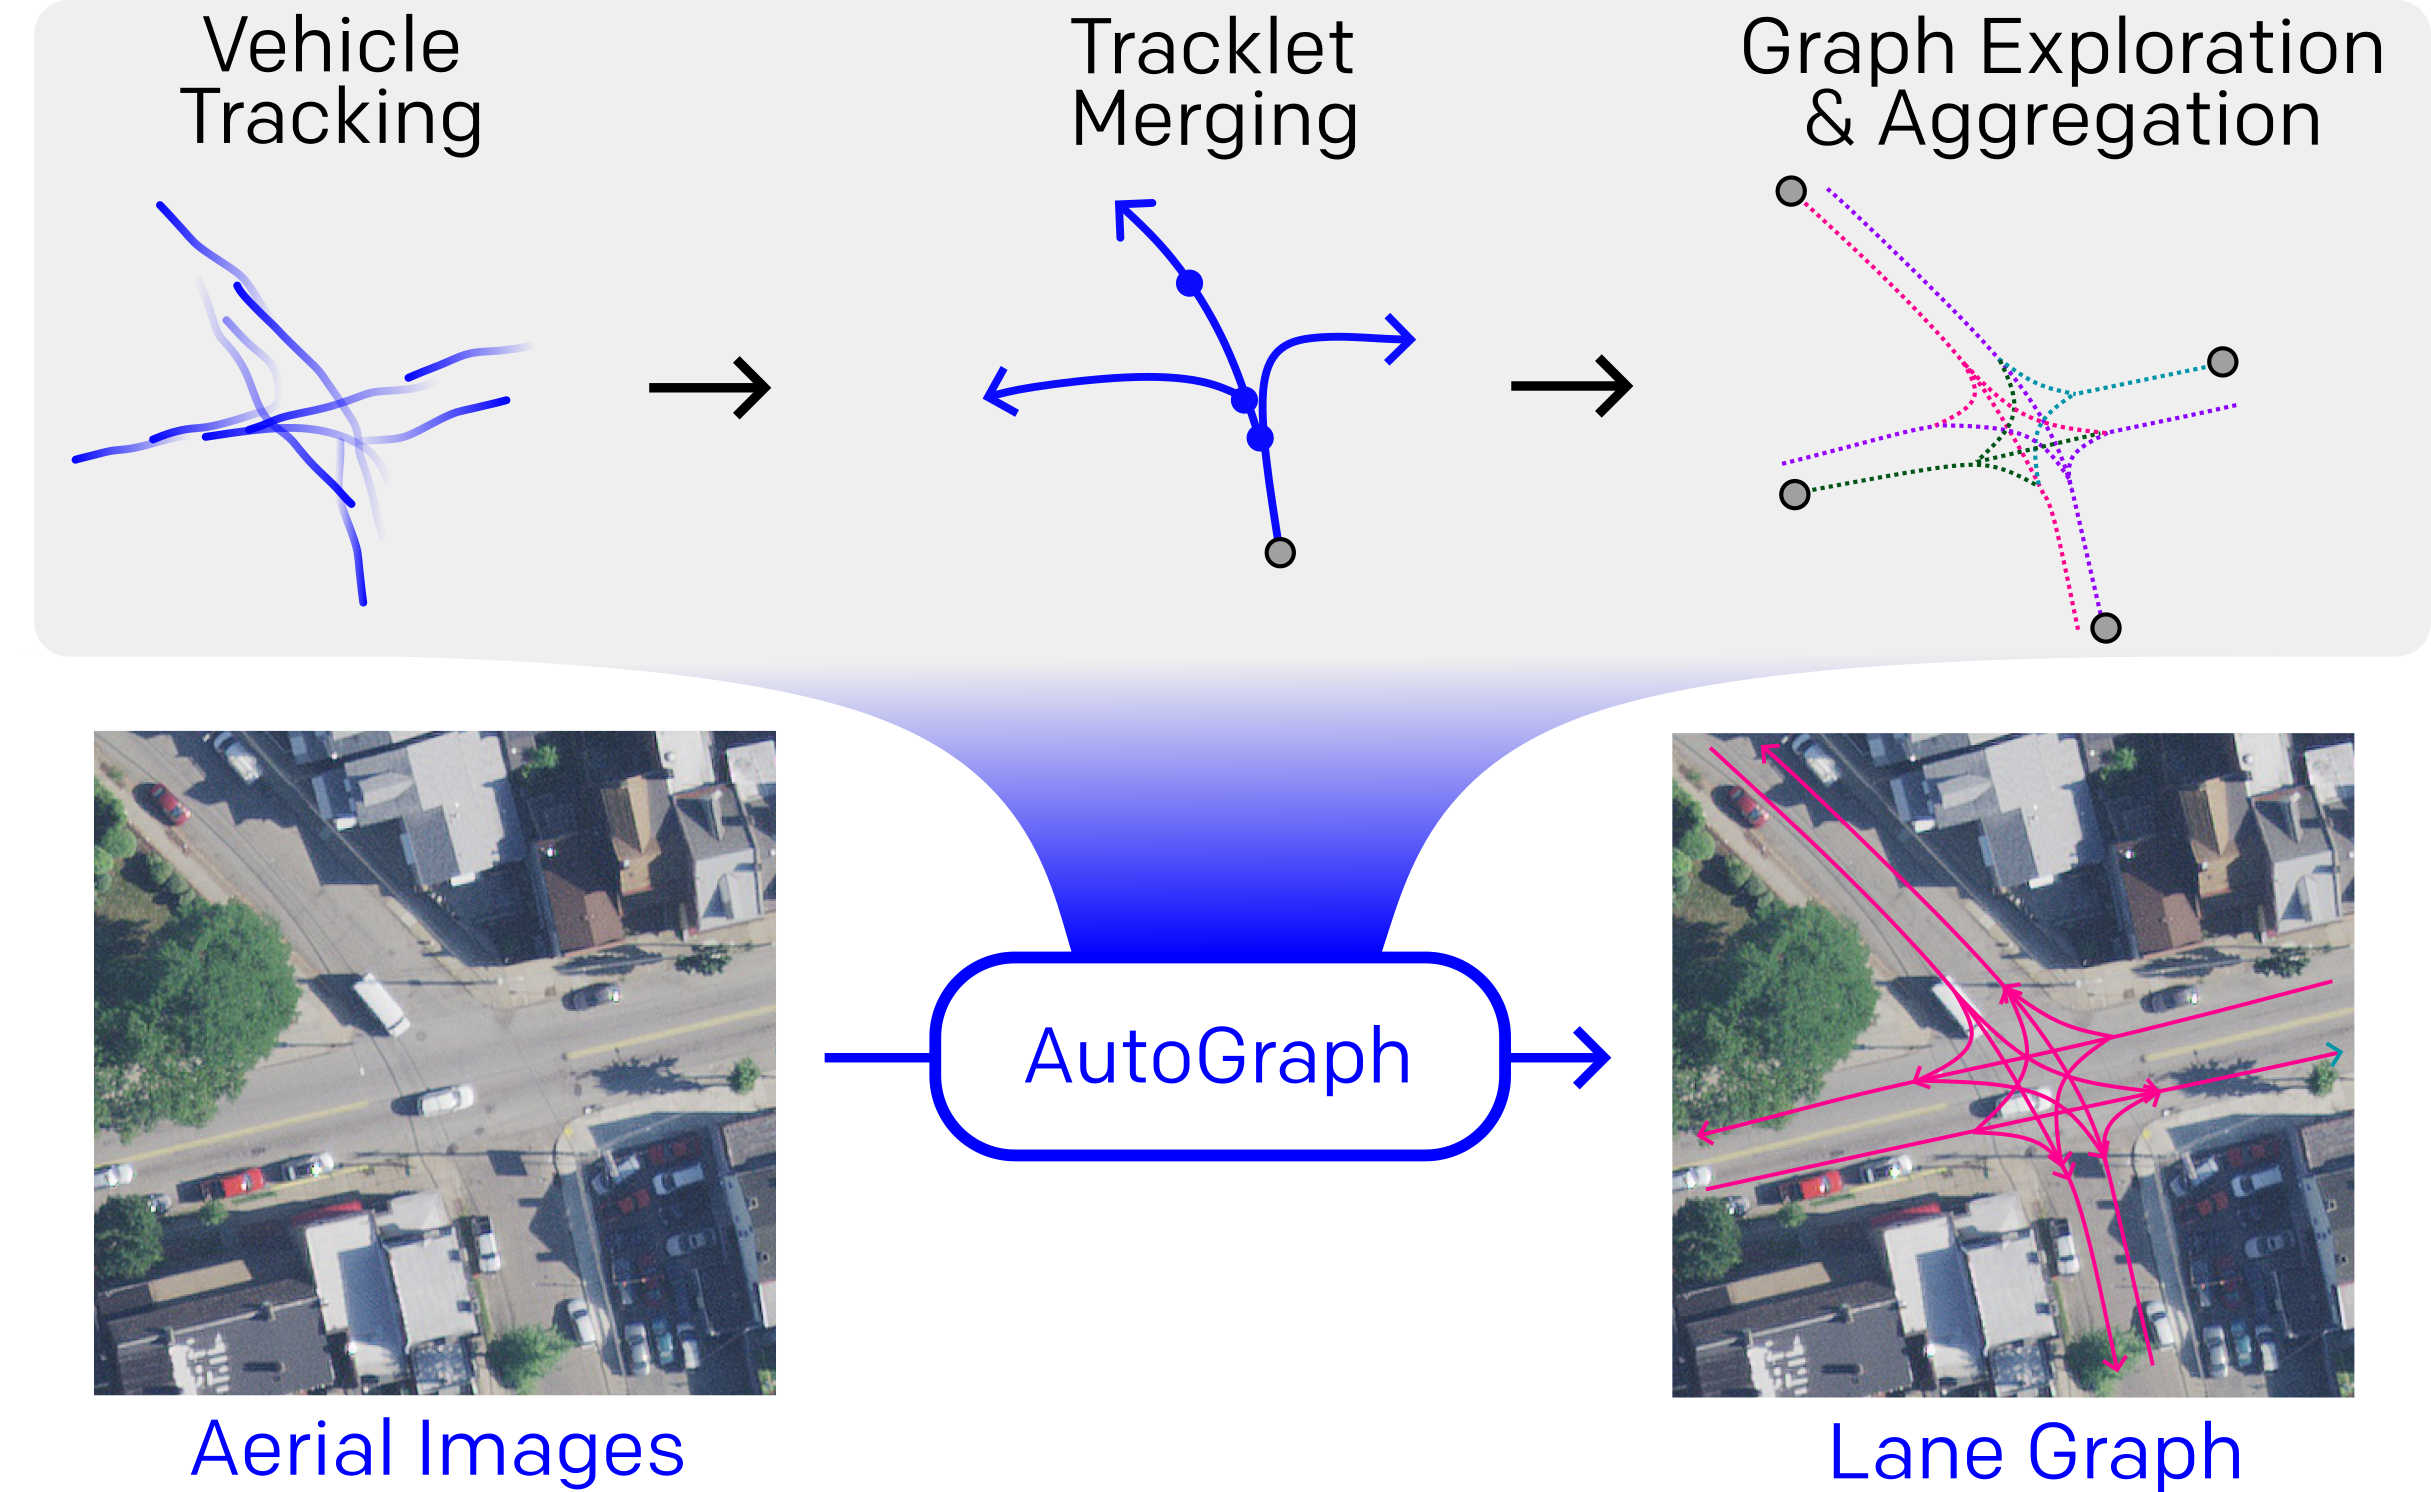
Our approach can be split into three distinct stages: First, tracklet parsing and merging, where we track traffic participants through all scenes in the dataset and prepare the data for model training. Second, model training, where we train the proposed models with data obtained in the first stage. Third, we perform inference with our trained models and aggregate the graphs into a globally consistent representation. In the following, we detail each component of our approach.

Tracklet Parsing and Merging

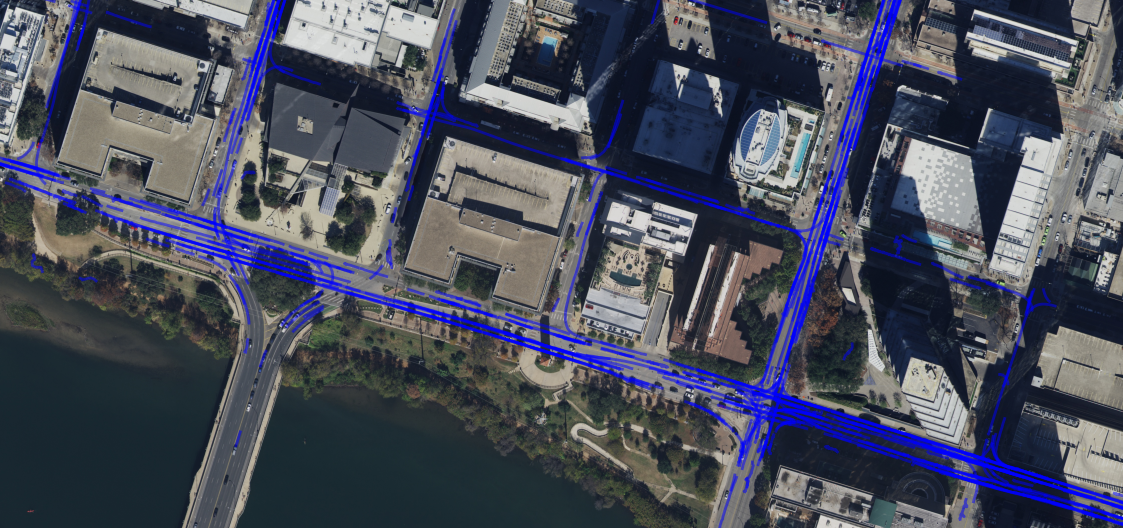
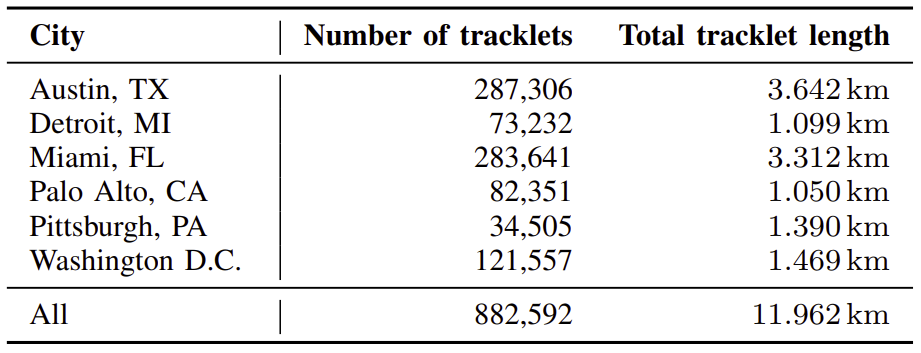
We start our data processing pipeline by tracking traffic participants in all available scenes of the Argoverse2 dataset across all six available cities. Each scene in the dataset consists of approximately 20 seconds of driving. For each scene, we track vehicles such as cars, trucks, motorcycles, and busses using a pre-trained LiDAR-based object detector. We transform all tracklets into a global coordinate frame. Subsequently, we smooth the tracklets with a moving average filter in order to minimize the amount of observation noise and the influence of erradic driving behavior (i.e. steering inaccuracies).

Successor Lane Graph Prediction

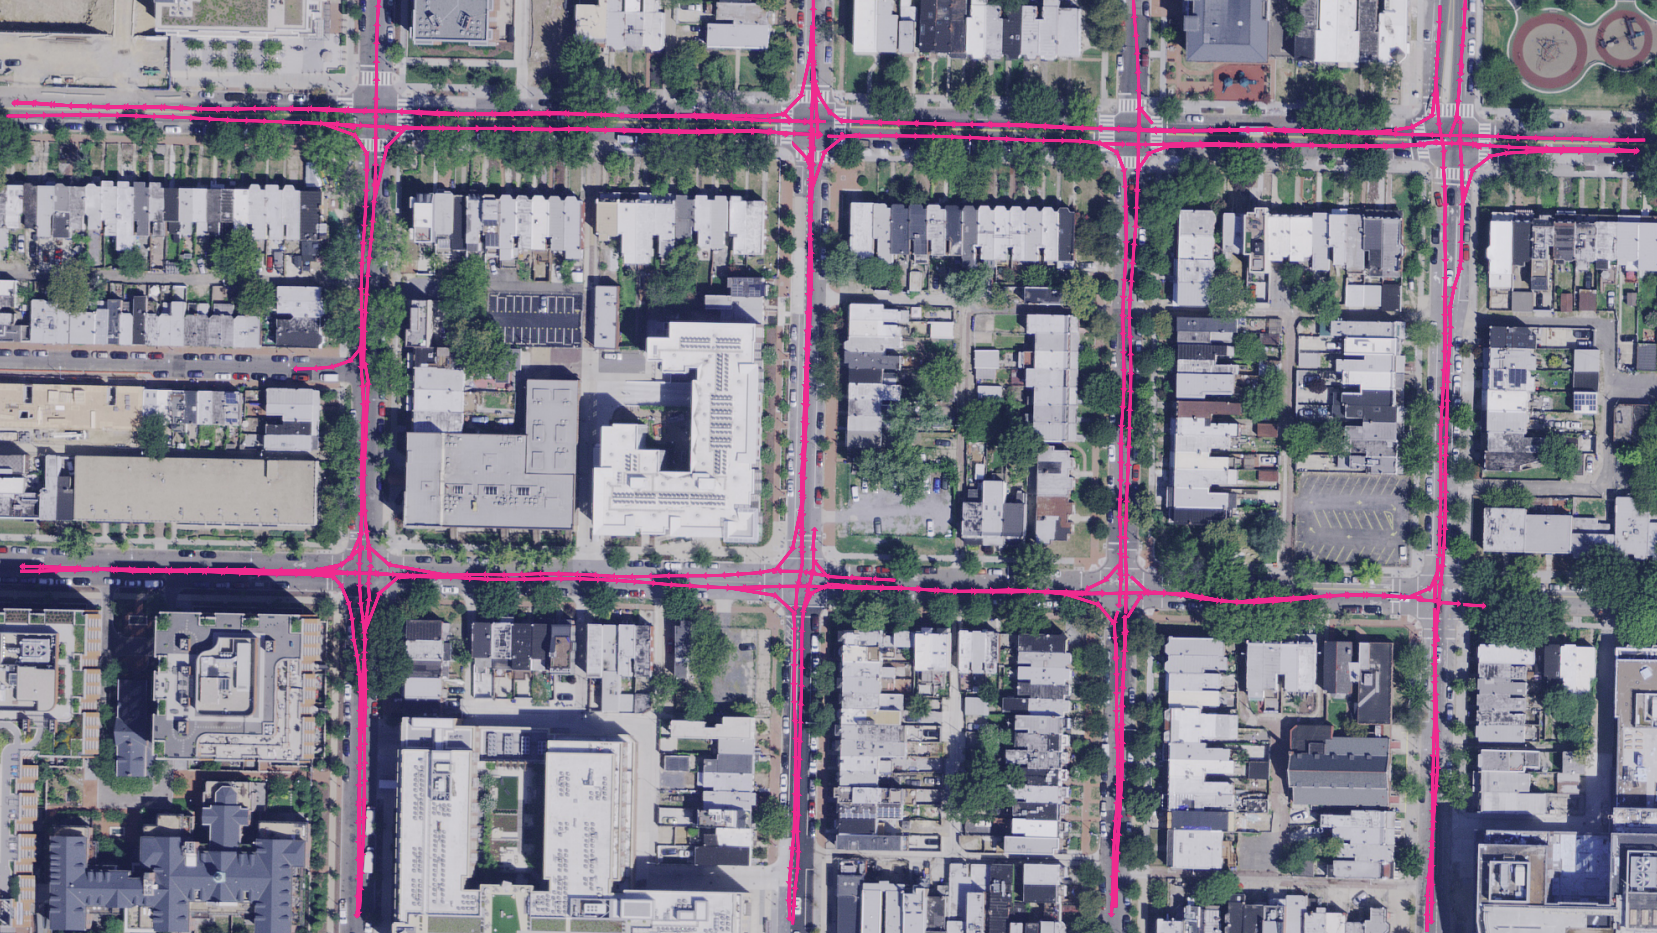
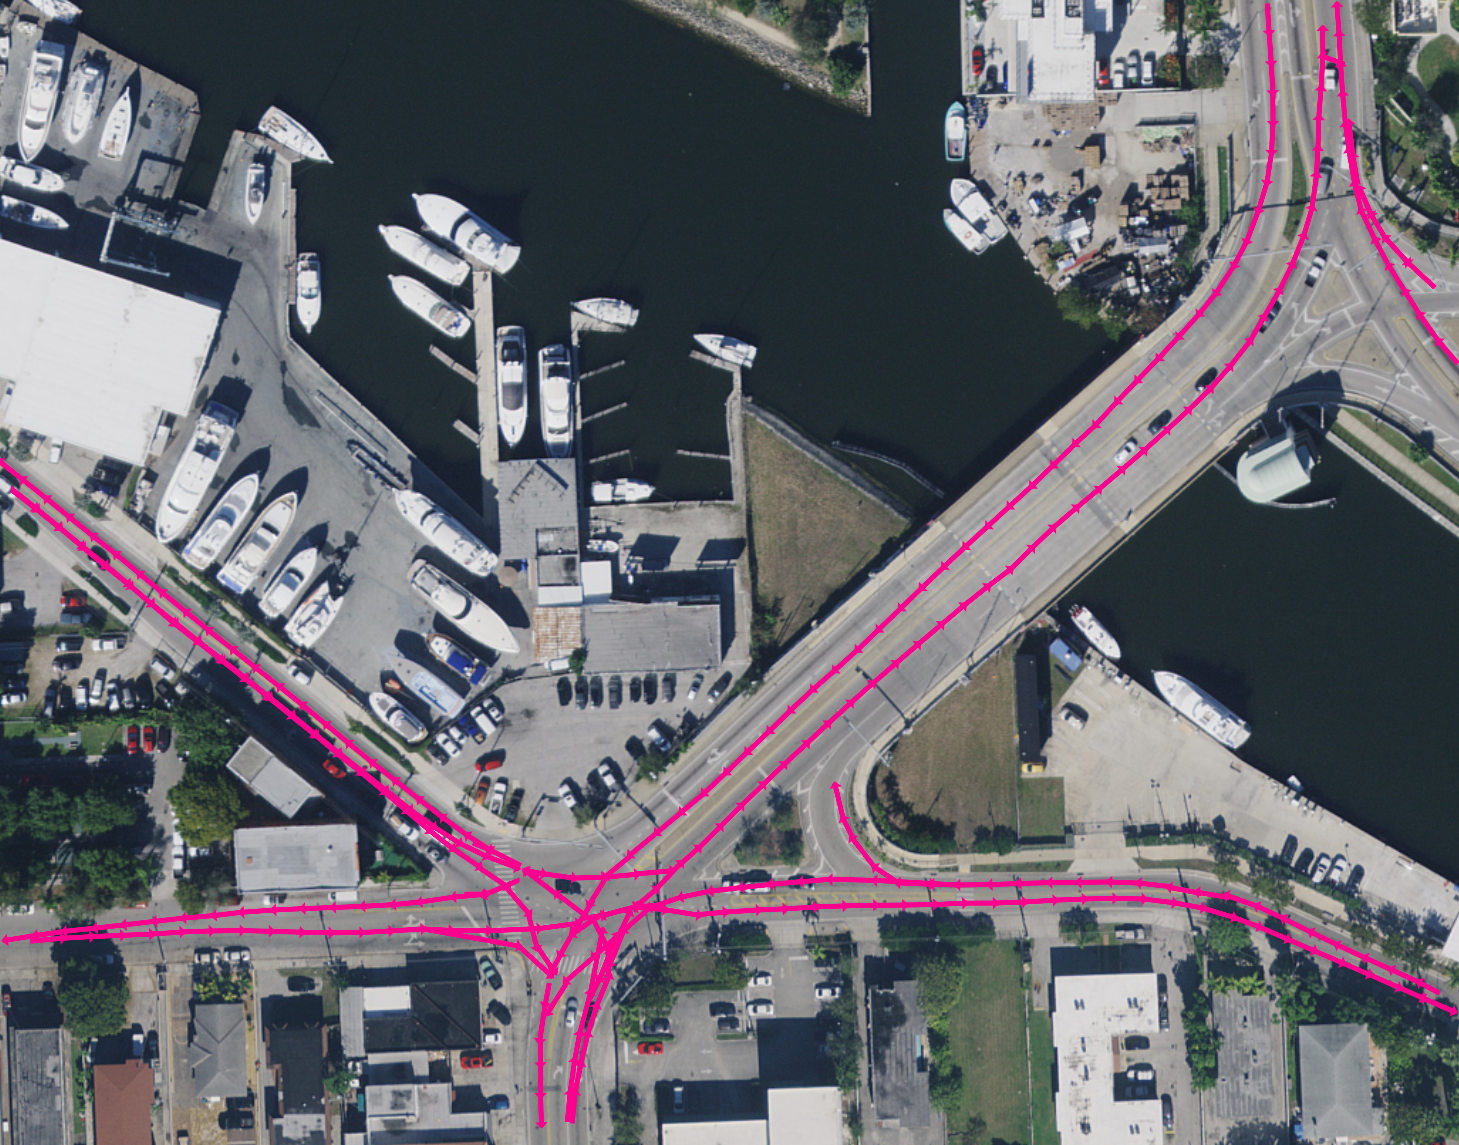
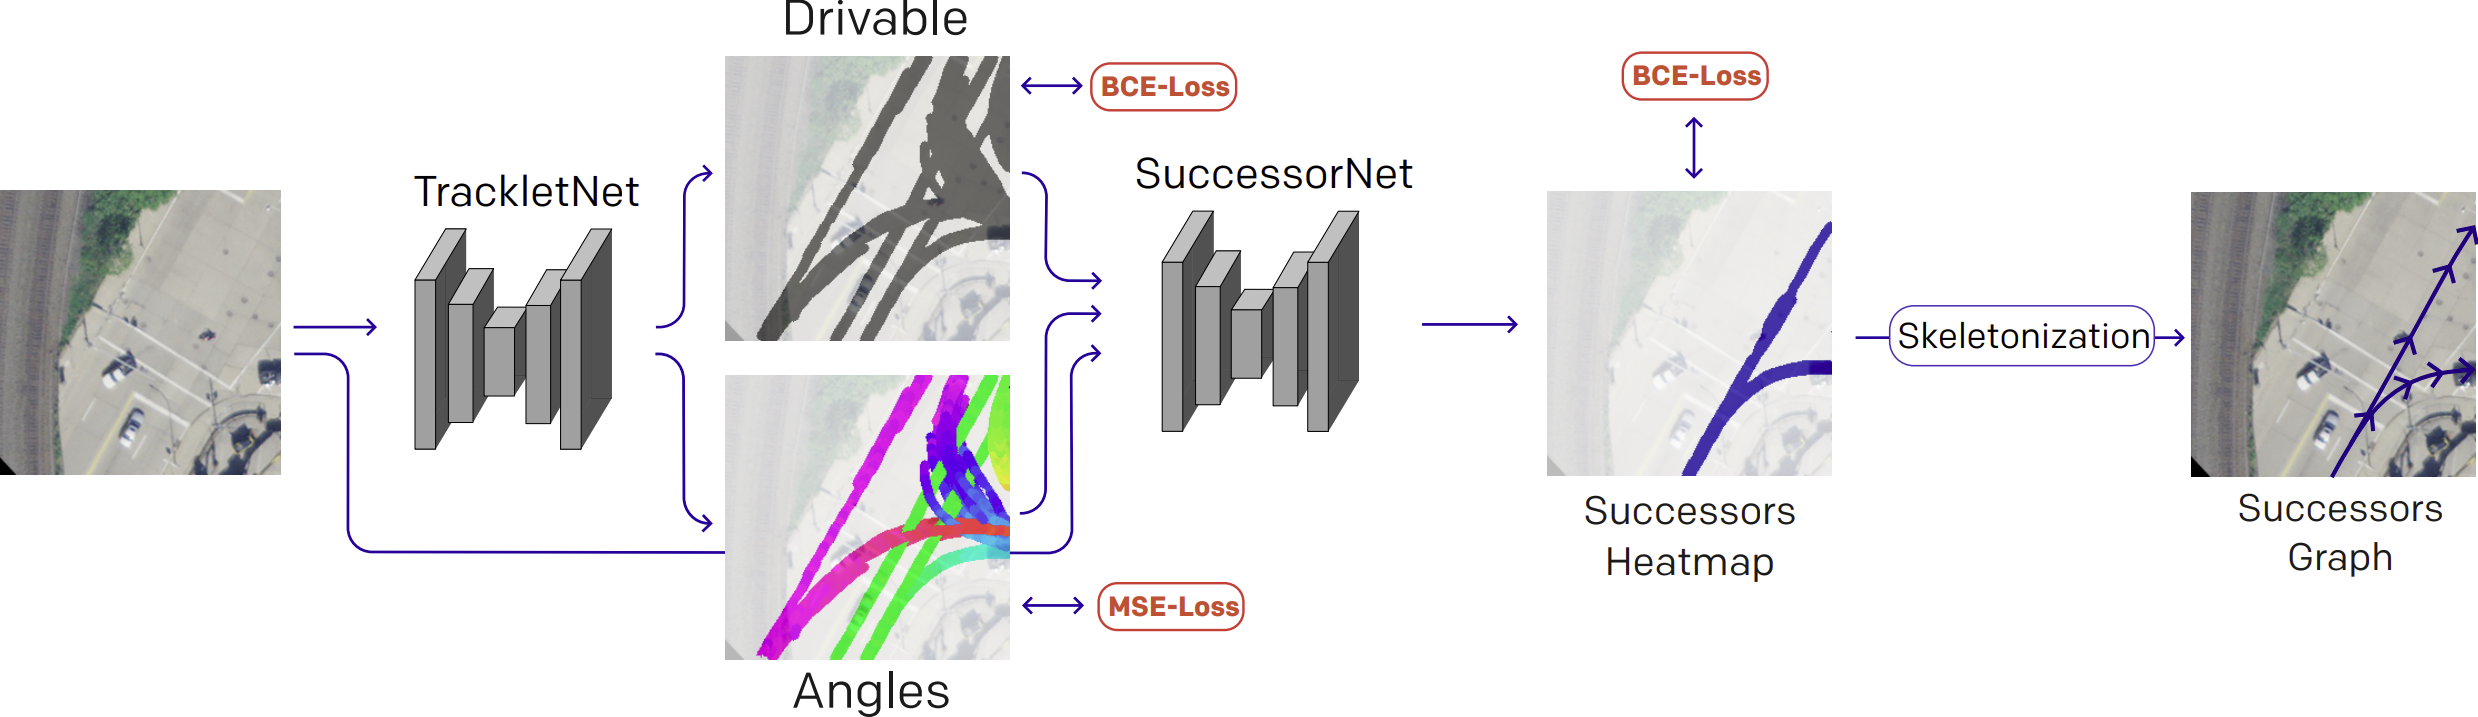
The whole training pipeline is visualized in the figure below. After our aggregation step, we are able to query all tracklets that are visible in an aerial image crop, starting from a given querying position. To obtain a training dataset for our models, for each query pose, we crop an aerial image from the aerial image,centered and oriented around the query pose. In the same way, we crop and center the drivable map and the angle map.

Our model consists of two sub-networks. As a first step, we train a DeepLabv3+ model to predict the pixel-wise drivable and angle maps from an RGB aerial image input. We denote this model as TrackletNet. This initial task is identified as an auxiliary task, leveraging the vast amount of tracklets readily available for a given crop. For training, we use a binary cross-entropy loss to guide the prediction of the drivable map layer and a mean squared error loss for the prediction of the angle map.
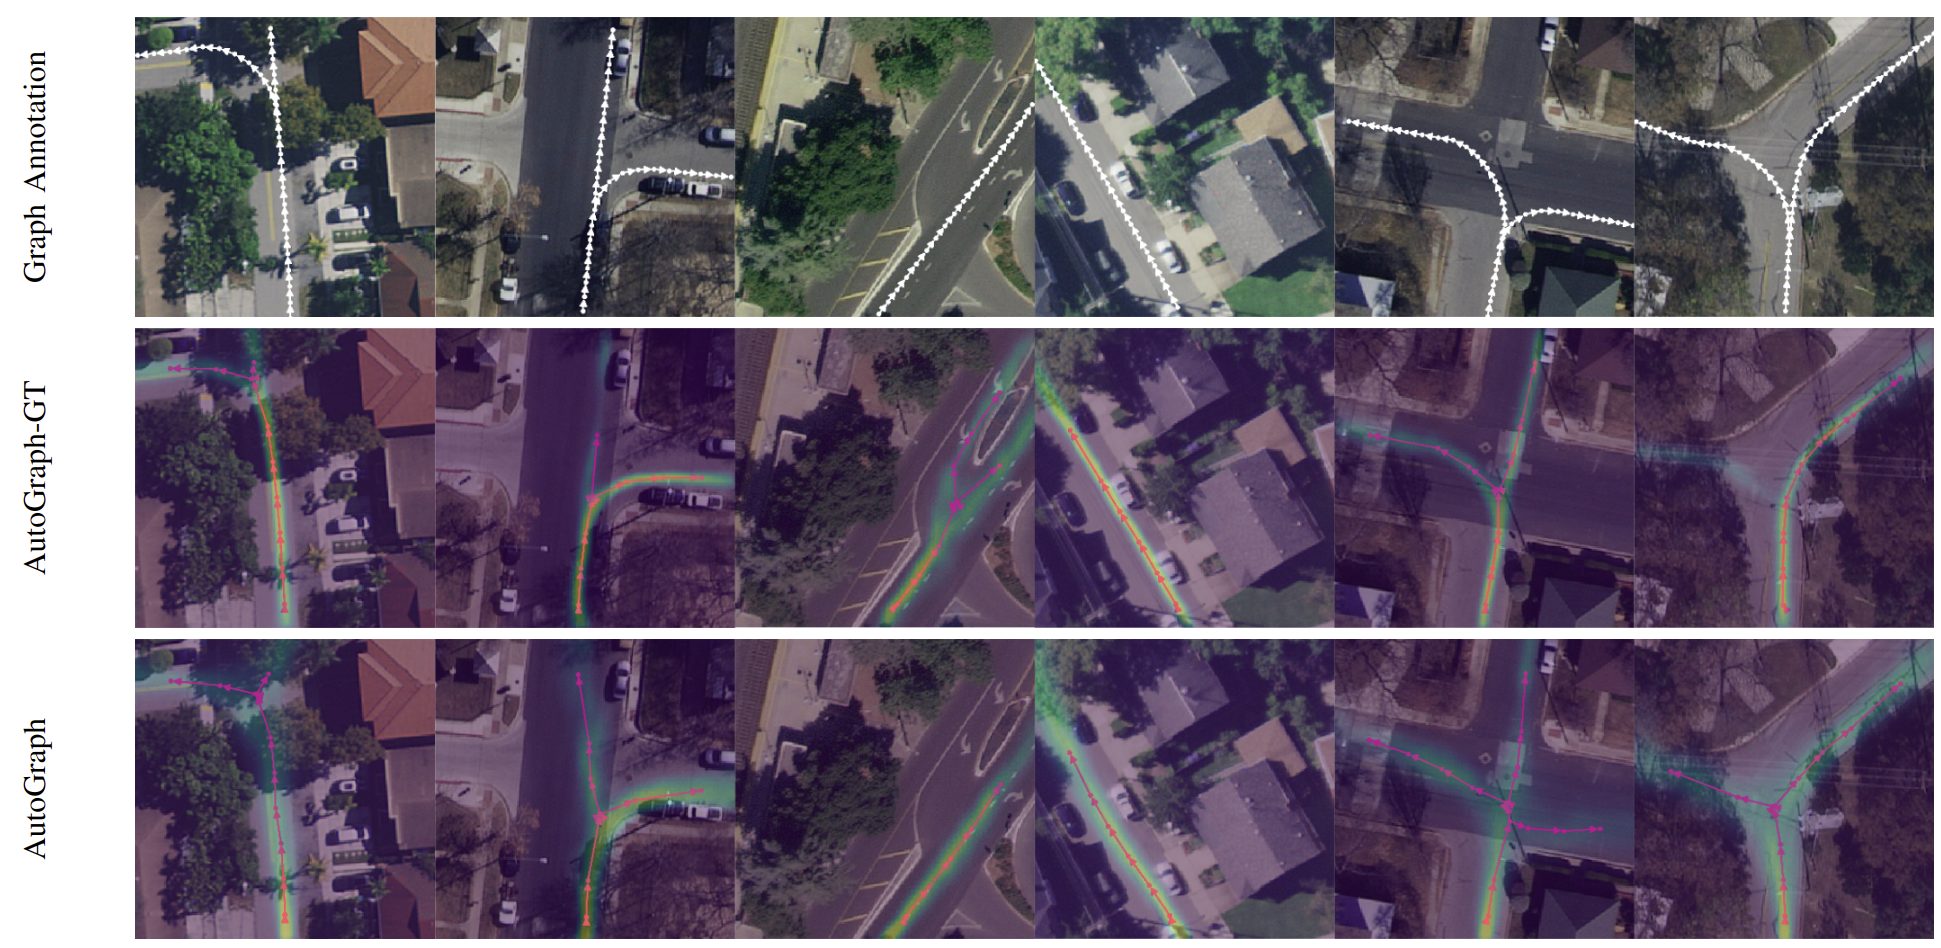
In the second step, we train a separate DeepLabv3+ model to predict the successor graph from a certain pose q, 
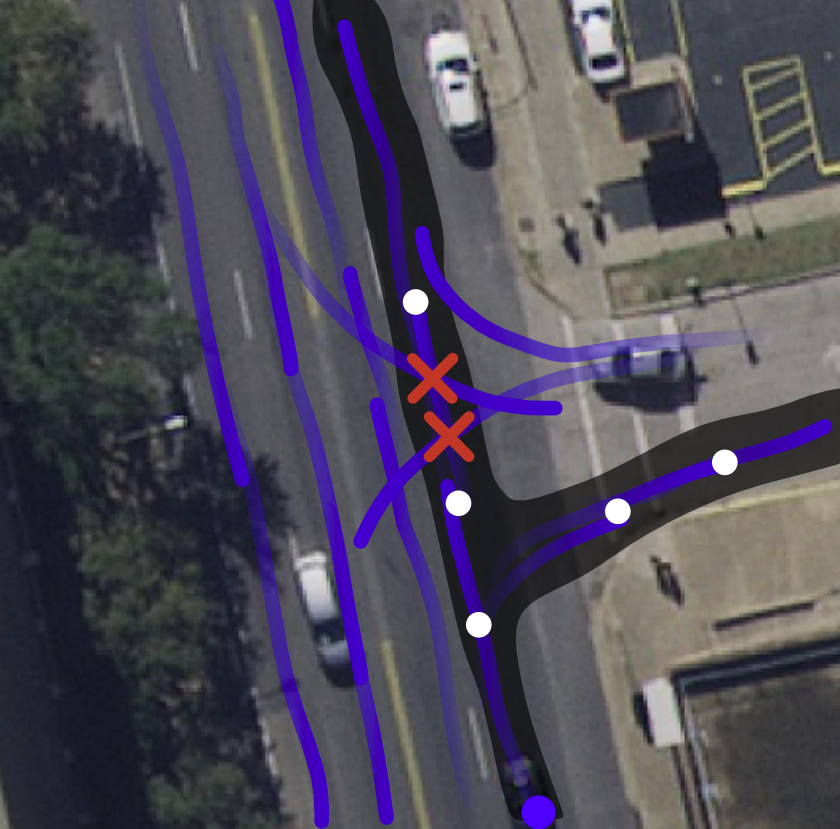
which we parameterize as a heatmap. To account for the additional Drivable and Angles input layers, we adapt the number of input layers of the DeepLabv3+ model architecture. We denote this model as SuccessorNet. To obtain per-pixel labeling of the successor graph in the image crop, we render the successor graph as a heatmap in the crop by drawing along the graph edges with a certain stroke width. This heatmap highlights all regions in the aerial image that are reachable by an agent placed at pose q. We train our SuccessorNet model with a binary cross-entropy loss. Finally, we skeletonize the predicted heatmap using a morphological skinning process and convert the skeleton into a graph representation.

Graph Exploration and Aggregation

In this section, we illustrate how a complete lane graph can be obtained from running our AutoGraph model iteratively on its own predictions and subsequently aggregating these predictions into a globally consistent graph representation. To this end, we leverage a depth-first exploration algorithm: We initialize our model by selecting start poses, which can either be selected manually or obtained from our TrackletNet model. We predict the successor graph from this initial position and query our model along the successor graph and repeat the process. In the case of a straight road section, for each forward pass of our model, a single future query pose is added to the list of query poses to process. If a lane split is encountered, for each of the successor subgraphs starting at lane splits, a query pose is added to the list. If a lane ends or no successor graphs are found, the respective branch of the aggregated lane graph terminates and the next pose in the list is queried. The exploration terminates once the list of future query poses is empty.

AutoGraph learns to predict successor graphs from vehicle tracklets and aggregates them into a single consistent lane graph

UrbanTracklets Dataset

We evaluate our proposed method on a large-scale dataset for lane graph estimation from traffic participants. We use the RGB aerial images and the ground-truth lane graph annotations from the UrbanLaneGraph dataset. To obtain the traffic participant tracklets, we leverage the LiDAR dataset split of the Argoverse2 dataset. The dataset contains consecutive LiDAR scans for hundreds of driving scenarios. We track the vehicle classes of Car, Bus, Trailer, and Motorcycle. Subsequently, we transform the respective LiDAR-centric tracklet coordinates to a global reference frame that is aligned with the aerial image coordinates. We smooth each tracklet with a mean filter approach to account for sensor noise and tracking inaccuracies. We call our tracklet dataset the UrbanTracklet dataset and make it publicly available as an addition to the UrbanLaneGraph dataset. Below, we list all relevant metrics of our UrbanTracklet dataset. In total, our dataset entails tracklets with an accumulated total length of approximately 12 000 km.

Dataset Download

We make our UrbanTracklet dataset available for download here:

Dataset


After unzipping, the dataset contains a .npy file for each city in the UrbanLaneGraph dataset. Each .npy file contains a list of tracklets for the respective city. The respective aerial images and human-annotated lane graphs may be found in the UrbanLaneGraph dataset.

Experiments

We evaluate our model on well-established tasks for lane graph estimation: Successor Lane Graph Prediction and Full Lane Graph Prediction.

Successor Lane Graph Prediction

Below, we visualize qualitative results of our AutoGraph and AutoGraph-GT models for the Successor-LGP task on the UrbanLaneGraph dataset. We observe that overall both models are capable of modeling the multimodal nature of successor graphs efficiently, however, the AutoGraph-GT model shows slightly better-defined heatmap outputs, since the annotations used for training were created from the ground-truth successor lane graph. For details, please check out the paper.

Qualitative results of our AutoGraph model for the Successor-LGP task on the UrbanLaneGraph dataset. We visualize the successor heatmap and the graph generated from it for our human-supervised model AutoGraph-GT and our trackletsupervised model AutoGraph.


Full Lane Graph Prediction

Below, we illustrate two exemplary visualizations of predicted lane graphs for the cities of Washington, D.C., and Miami.

We observe that our approach is capable of accurately reconstructing the lane graph in visually challenging environments. Large scenes with multiple blocks are handled well and clearly reflect the underlying lane graph topology. The detail view for a complex intersection in Miami illustrates that almost all major intersection arms are covered even in the presence of visual clutter such as water, boats, parking lots, and concrete-colored buildings. Minor inaccuracies are produced at the five-armed intersection at the bottom of the aerial image, where not all connections between intersection arms are present in the inferred lane graph.

Full lane graph prediction result - Washington, D.C.


Full lane graph prediction result - Miami, detail view.


BibTeX

@article{zurn2023autograph,
  title={AutoGraph: Predicting Lane Graphs from Traffic Observations},
  author={Z{\"u}rn, Jannik and Posner, Ingmar and Burgard, Wolfram},
  journal={arXiv preprint arXiv:2306.15410},
  year={2023}
}

Acknowledgements

We thank the Argoverse2 team for making the Argoverse2 datset (https://www.argoverse.org/av2.html) publicly available and for allowing the re-distribution of their dataset in remixed form.

People